Example 1
 Below are a few lines of Pharo code to exercise multidimensional profiling with Rizel. The following script allows the performance of Rizel-Test-Scenario to be measured for 4 benchmarks over 5 demo versions.
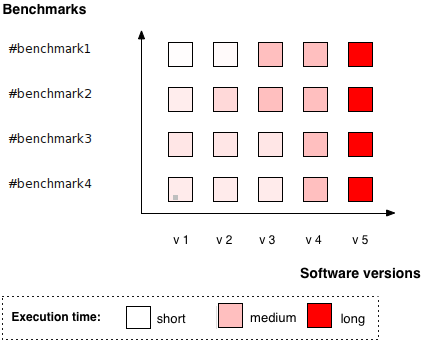
The image on the left hand (Performance Comparison Matrix) shows the performance evolution of 4 benchmarks over 5 versions of Rizel-Test-Scenario. We can see that the performance of some of the benchmarks have decreased over the difference versions.
Below are a few lines of Pharo code to exercise multidimensional profiling with Rizel. The following script allows the performance of Rizel-Test-Scenario to be measured for 4 benchmarks over 5 demo versions.
The image on the left hand (Performance Comparison Matrix) shows the performance evolution of 4 benchmarks over 5 versions of Rizel-Test-Scenario. We can see that the performance of some of the benchmarks have decreased over the difference versions.
                        RzRizelDemo>>totalExecutionTime


                         |versions benchmarks builder result|

                         builder := RzBuilder new.

                         versions := #( '1' '2' '3' '4' '5').

                         benchmarks := #( #benchmark1 #benchmark2 #benchmark3 #benchmark4).

                         "defining variables and execution context"

                         builder define: #input named: #version 	  with: versions.

                         builder define: #input named: #benchmark   with: benchmarks.

                         "automatic execution"

                         result := builder execute: [ :version :benchmark |

                         	 Gofer new

                         	 		url:'http://ss3.gemstone.com/ss/Rizel';

                         	 		version: 'Rizel-Test-Scenario-JuanPabloSandovalAlcocer.',version;

                         	 		load.

                         	 [ self perform: benchmark ] timeToRun.].

                         "visualizing results"

                         RzVisualizer2D new

                           					xValues: versions;

                           					yValues: benchmarks;

                           					value: [ :version :bench |  result at: (RzVector <== version+bench)];

                           					padding: 150;

                           					visualize.
Example 2
 The following script allows the performance of Rizel-Test-Scenario to be measured for 1 benchmark over 5 demo versions.
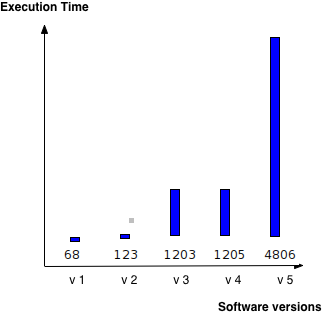
The image on the left hand shows the performance degradation of the #benchmark1 of Rizel-Test-Scenario.
The following script allows the performance of Rizel-Test-Scenario to be measured for 1 benchmark over 5 demo versions.
The image on the left hand shows the performance degradation of the #benchmark1 of Rizel-Test-Scenario.
                       RzRizelDemo>>executionTimeBenchmark1

                         |versions benchmarks builder result|

                         builder := RzBuilder new.

                         versions := #( '1' '2' '3' '4' '5').

                         "defining variables and execution context"

                         builder define: #input named: #version 	  with: versions.

                         "automatic execution"

                         result := builder execute: [ :version |

                              Gofer new

			   	url:'http://ss3.gemstone.com/ss/Rizel';

			   	version: 'Rizel-Test-Scenario-JuanPabloSandovalAlcocer.',version;

			   	load.

                                  [  self perform: #benchmark1 ] timeToRun.].

                         "visualizing results"

                         RzVisualizer1D new

                                      values: (versions collect:[ :v | result at:(RzVector <== v)]);

                                                                 visualize.
Example 3
 The following script merge two profiles to detect and visualize topological and weight differences between them.
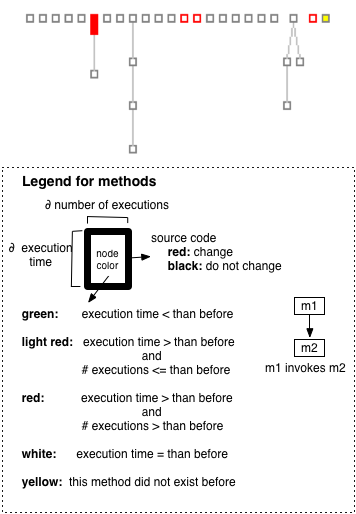
The image on the left hand (Performance Evolution Blueprint) compares the profiles [ #benchmark1 ; version1 ] and [#benchmark ; version 4];
showing the methods that have had source code changes (boxes with red border) and the impact of such changes in the performance (red and large boxes)
The following script merge two profiles to detect and visualize topological and weight differences between them.
The image on the left hand (Performance Evolution Blueprint) compares the profiles [ #benchmark1 ; version1 ] and [#benchmark ; version 4];
showing the methods that have had source code changes (boxes with red border) and the impact of such changes in the performance (red and large boxes)
                      RzRizelDemo>>methodExecutionTime

                         |versions benchmarks A B rzProfile builder|

                         builder := RzBuilder new.

                         builder define: #input named: #version with: #('1' '4').

                         result := builder execute: [ :version |

			  	Gofer new

			   		url:'http://ss3.gemstone.com/ss/Rizel';

			   		version: 'Rizel-Test-Scenario-JuanPabloSandovalAlcocer.',version;

			   		load.

			  	Smalltalk garbageCollect.

			  	builder profile:[ self perform: #benchmark3 ] inPackagesMatching: 'Rizel-Test-Scenario'

                                  ].

                             ].

                         "merge profiles"

                         rzProfile := RzProfile merge: (result at: #('1')) with: (result at: #('4')).

                         "display results"

                         (RzVisualizerMerge on: rzProfile) visualize.