The Hy+ system provides extensive support for query visualization, visualizing the input instance, and visualizing the output instance in several different modes. The visualizations manipulated by the system are labeled graphs and hygraphs.
Each tuple (a1, ..., ai, b1, ..., bj, c1, ..., ck) in a relational database can be represented by a directed multigraph having an edge labeled r(c1, ... ,ck) from a node labeled a1, ..., ai) to a node labeled (b1, ..., bj) corresponding to each tuple of each relation r in the database.
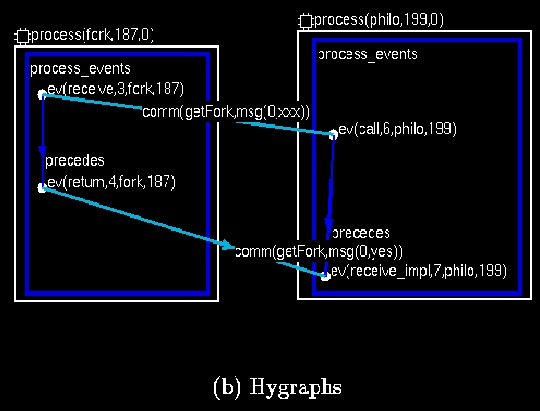
The data model we use is more general than graphs. Hygraphs , are a hybrid between Harel's higraphs and directed hypergraphs. A hygraph extends the notion of a graph by incorporating blobs in addition to edges. A blob relates a containing node with a set of contained nodes and is diagrammatically represented as a region associated with the container node that encloses the contained nodes. Following figure shows two blobs where the philo and fork processes ( blob nodes) contain their respective communication events ev(...).. A node may have multiple blobs associated with it, and blobs may be arbitrarily nested. Extending the representation to hygraphs allows varying levels of abstraction in the display of hierarchical data and provides a flexible mechanism for clustering information.
